Frequent Questions
Real-time, continuous, millimeter precision positioning is not any kind of positioning, it requires a lot of attention and scrutiny to prove efficient and reliable. That’s why, at Ophelia Sensors, we’ve created innovative algorithms designed for this specific matter, enabling the possibility to take care of any peculiar event that can arise for the Geocube.
Without going in too much of the science behind the algorithm we have developed, let’s take a quick tour of how the positioning algorithm operates.

Take a look at the figure above, it represents a simplified version of our algorithm (yes, the true version is much, much more complex). The 4 squares “Continuous Positioning”, “Problem Detected”, “Unknown Position”, “Verification of New Position” represent the possible states of the Geocubes, while the arrows are the state transitions possibly occurring during the lifetime of a project.
Let's review them.
When you turn on your Geocube, its position is unknown by the system. Hence, we start in the “Unknown Position” state: the algorithm needs to compute a new position. For that, we first need to gather some data and then solve complicated math stuff to find a first position. When a solution is successfully figured out, we are ready to give you a precise position and compute it in real-time.
But hold on a second. As you may have noticed, the arrow leaving the “Unknown Position” state first goes to the “Verification” state. Indeed, at Ophelia Sensors, failure is not in our vocabulary, and we do not allow ourselves to give you inaccurate or uncertain positioning data. The previous solution is considered as a first candidate to our positioning problem, and we need to check it corresponds to the true physical position!
“More waiting time?” might you think. Don’t worry, if the verification stage is successful, all the data computed and kept on hold will be published as if nothing had happened.
Depending on the result of the verification process, we might come back to the “Unknown Position” state if unsuccessful, or, most likely, we finally switch to the “Continuous Positioning” state and start computing in real-time mode.
You’ve finally reached cruising speed, the Geocube is in the “Continuous Positioning” state: see, it wasn’t that long, was it? On a typical installation, this process would take less than 1 hour. Once we have our initial position, the algorithm computes a position for the Geocube every 30 seconds, allowing you to follow potential displacements. You can now observe its movement, check if all other Geocubes positions are also computed, or simply go back to your routine activities, everything is under control.
So what about the last state, what is this anomaly that is detected? At times, the positioning algorithm might return an unsatisfactory result, and we prefer to let you know something unusual occurred. What is the problem with the positioning? We are not sure yet, but your Geocube will switch to “Anomaly Detected” state. Precise positions are still computed, but temporarily kept on hold until we figure out what happened. Whether it’s a large and sudden move or simply a temporary change of environment, a different set of algorithms will check possible scenarios before sending your data. If we can’t find a satisfactory position in the vicinity of the previous known position, chances are the Geocube has moved considerably and we will need to restart the process, switching back to “Unknown position” state to find a new position. On the other hand, if it was only a temporary change of environment and the last certain position is still the most coherent, we’ll reverse to “Continuous Positioning” state, and publish seamlessly your result that were temporarily on hold.
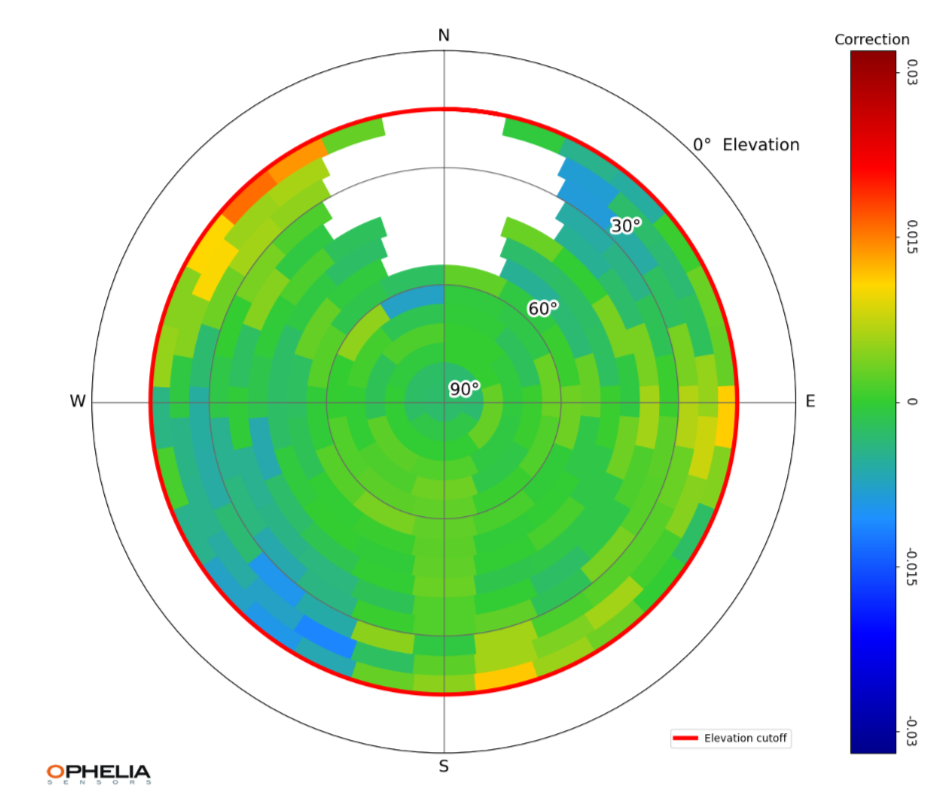
As you can see, each Geocube has its own activity and makes its own decisions. They are even learning! Geocubes will adapt their behavior based on their past results. Learning is twofold. First, the reactivity of a given Geocube is constantly adapted to its past performance. Reliability is improved by adjusting the detection thresholds and calculation parameters. Secondly, each Geocube plots their own multipath map, day after day, and proceeds to correct their measurements according to this map, as shown in figure 3. These corrections allow the real-time positioning to be even more robust, and for each Geocube to act in more relevant ways based on their environment.
So, your Geocube has now been functioning for some time, and you’d like to see the results: that’s the purpose of the Graphs tab, and you’re in luck, because that’s what we are reviewing right now.
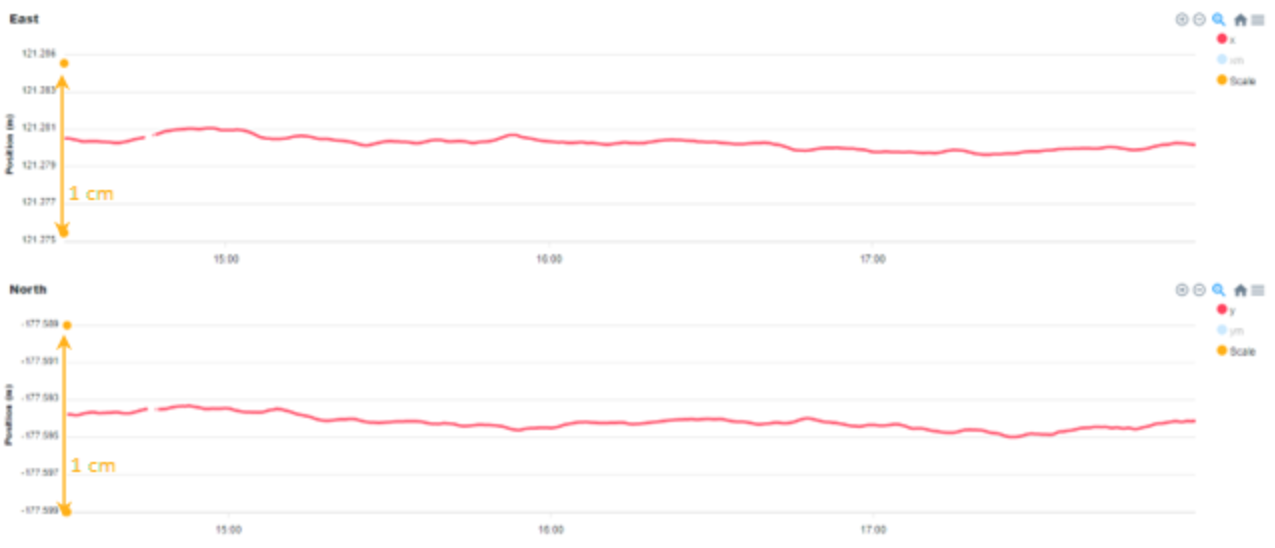
The graphs are accessible a few hours after installation, time for the positions to converge and settle, but for the sake of clarification, let’s look at a Geocube that was installed a couple of weeks back. For each cube, you can access a number of graphs such as the position, and some monitoring features (temperature, voltage, tilt, …). You can also compare the displacements of different sets of Geocubes.
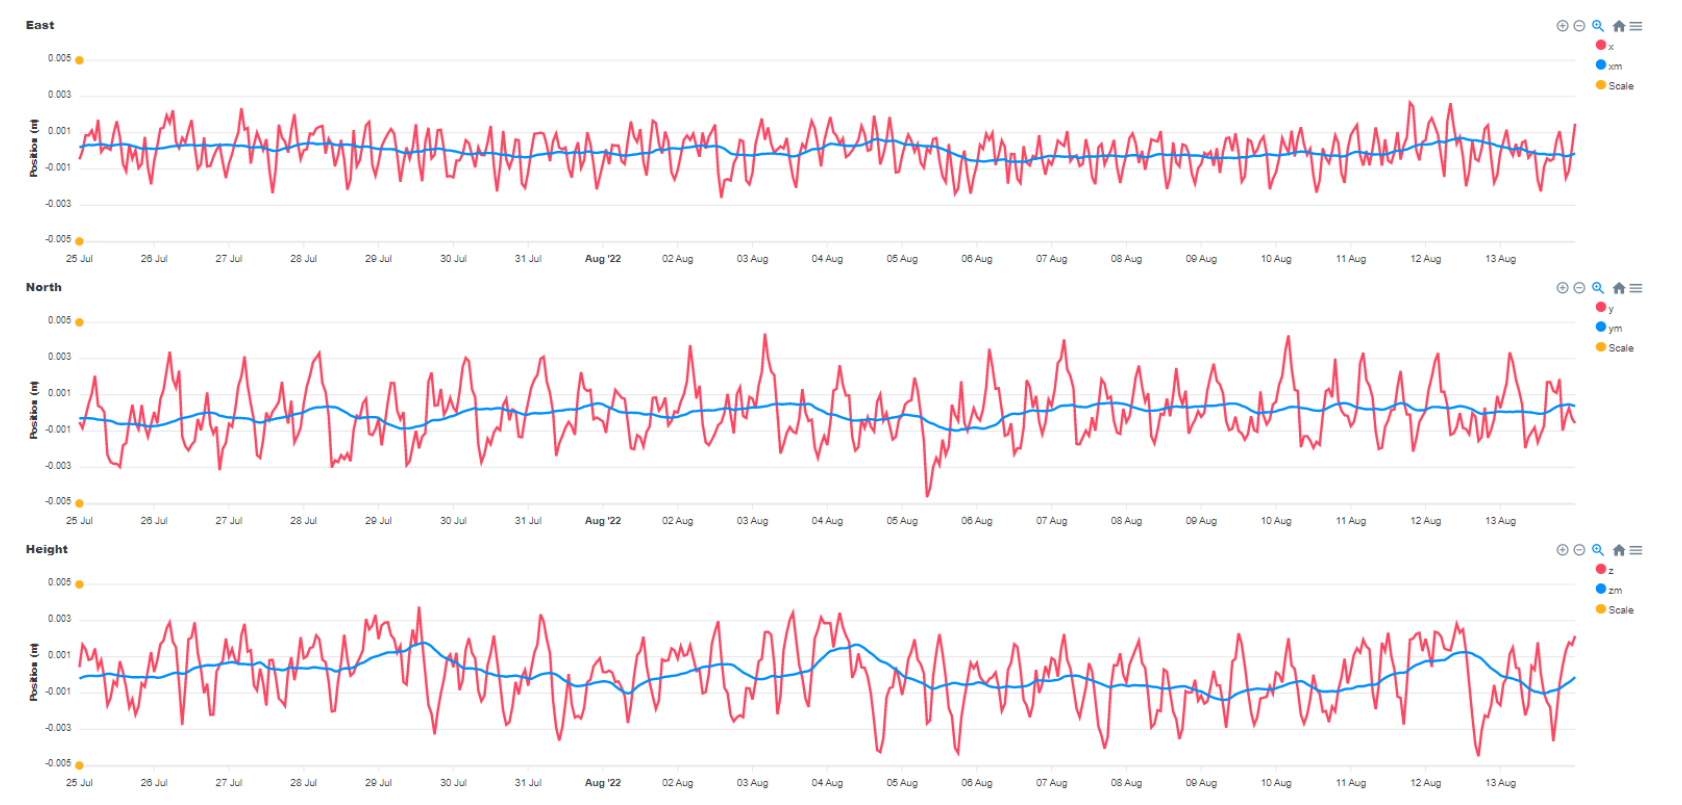
Let’s take a look at the positioning part. For each dimension (on figure 1, East, North and Up) you get two curves : one red and one blue. The red curve represents the real-time data with one point every 30 seconds directly from our computation algorithm. The blue curve is obtained after filtering your data with attributes selected in the graph settings. In the case presented in figure 1, the filter applied is a moving average over 1 day.
As you can see, the red curve is noisier, and shows some spikes throughout the day. The height of these spikes is mostly dependent on the quality of the sky view of the Geocube. The second largest factor in these spikes are the multipaths, which you can never completely cancel, and results in a sinusoidal movement around the real position. That is why you can apply a filter on this data to smoothen the curve as it mitigates all these effects at the first order, and improve your precision
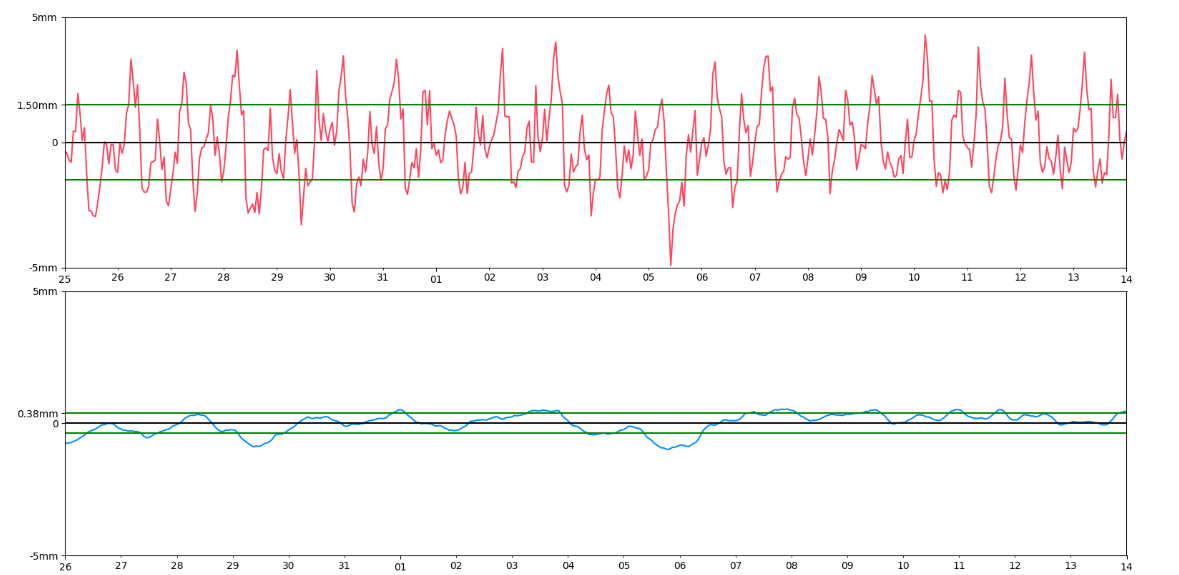
On figure 2 we zoomed in on the red and the blue curve of the North graph of figure 1, plotted the average on the full period in black, and finally, in green, a representation of the standard deviation around the mean of these curves. The standard deviation of the real-time red curve is 1.5mm, while the one of the averaged blue curve is 0.38mm, improving by more than 3 times the real-time data! As expected, the filter mitigates the error and allows a better precision. You can hence think of these two curves in the following way: the blue curve is the most precise and allows to follow small but slow motion over time, while the red curve gives real-time information on the system, at the expense of more noise.
Let’s now go a bit deeper in the filtering process, and in a more general way on the graph settings (see figure 3). As you can see, we provide you with a few different options, so as to adapt the results depending on the type of project you are working on.
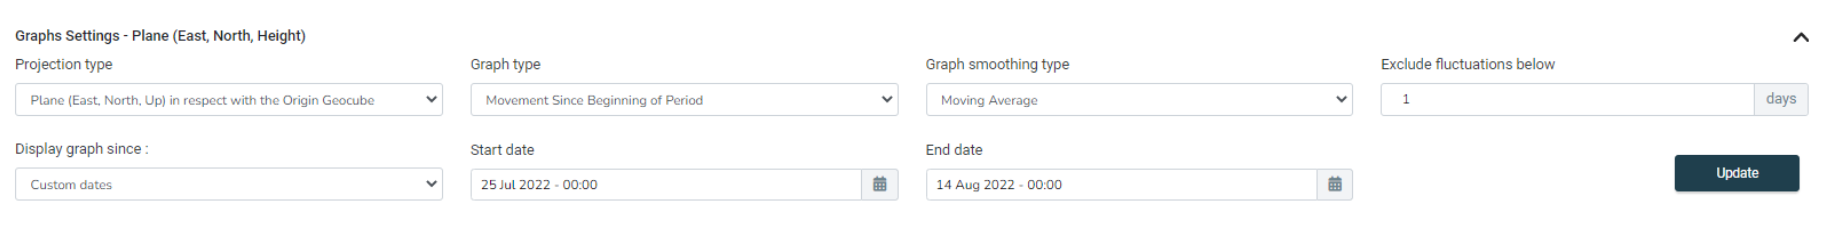
You can start by choosing the projection type: Earth Centered Cartesian coordinates, East North Up coordinates, or any other projection that could be relevant to you. The list is not exhaustive, and we’ll be pleased to help you if you need a specific type of coordinates, just ask the team!
The drop-down menu called “Graph type” allows you to choose between absolute or relative position while the “Display graph since” menu allows you to select any period of time of the graph (yes, you can go as far as several years).
You will also find three options as filtering / smoothening options:
“Daily Average” is quite simply a scatter graph with one point per day. In the case of “Moving Average” and “Low-pass Filter”, you also have to choose the time period on which to apply the filters (which is one day by default). As a rule of thumb, any repeated motion with a period lower than this chosen period will be mitigated, leaving you with a filtered curve that’s only made of the slower variations. The main advantage of these filters is to eliminate the first order of multipath errors, as most of these are repeated every day (see box).
The last important point is the difference between “Moving Average” and “Low-pass Filter”. Without going into too much details, they act a bit differently on the frequencies they mitigate. Just experiment different settings and find your best : we made sure we gave you a range of options without drowning you in an overwhelmingly large number of parameters!
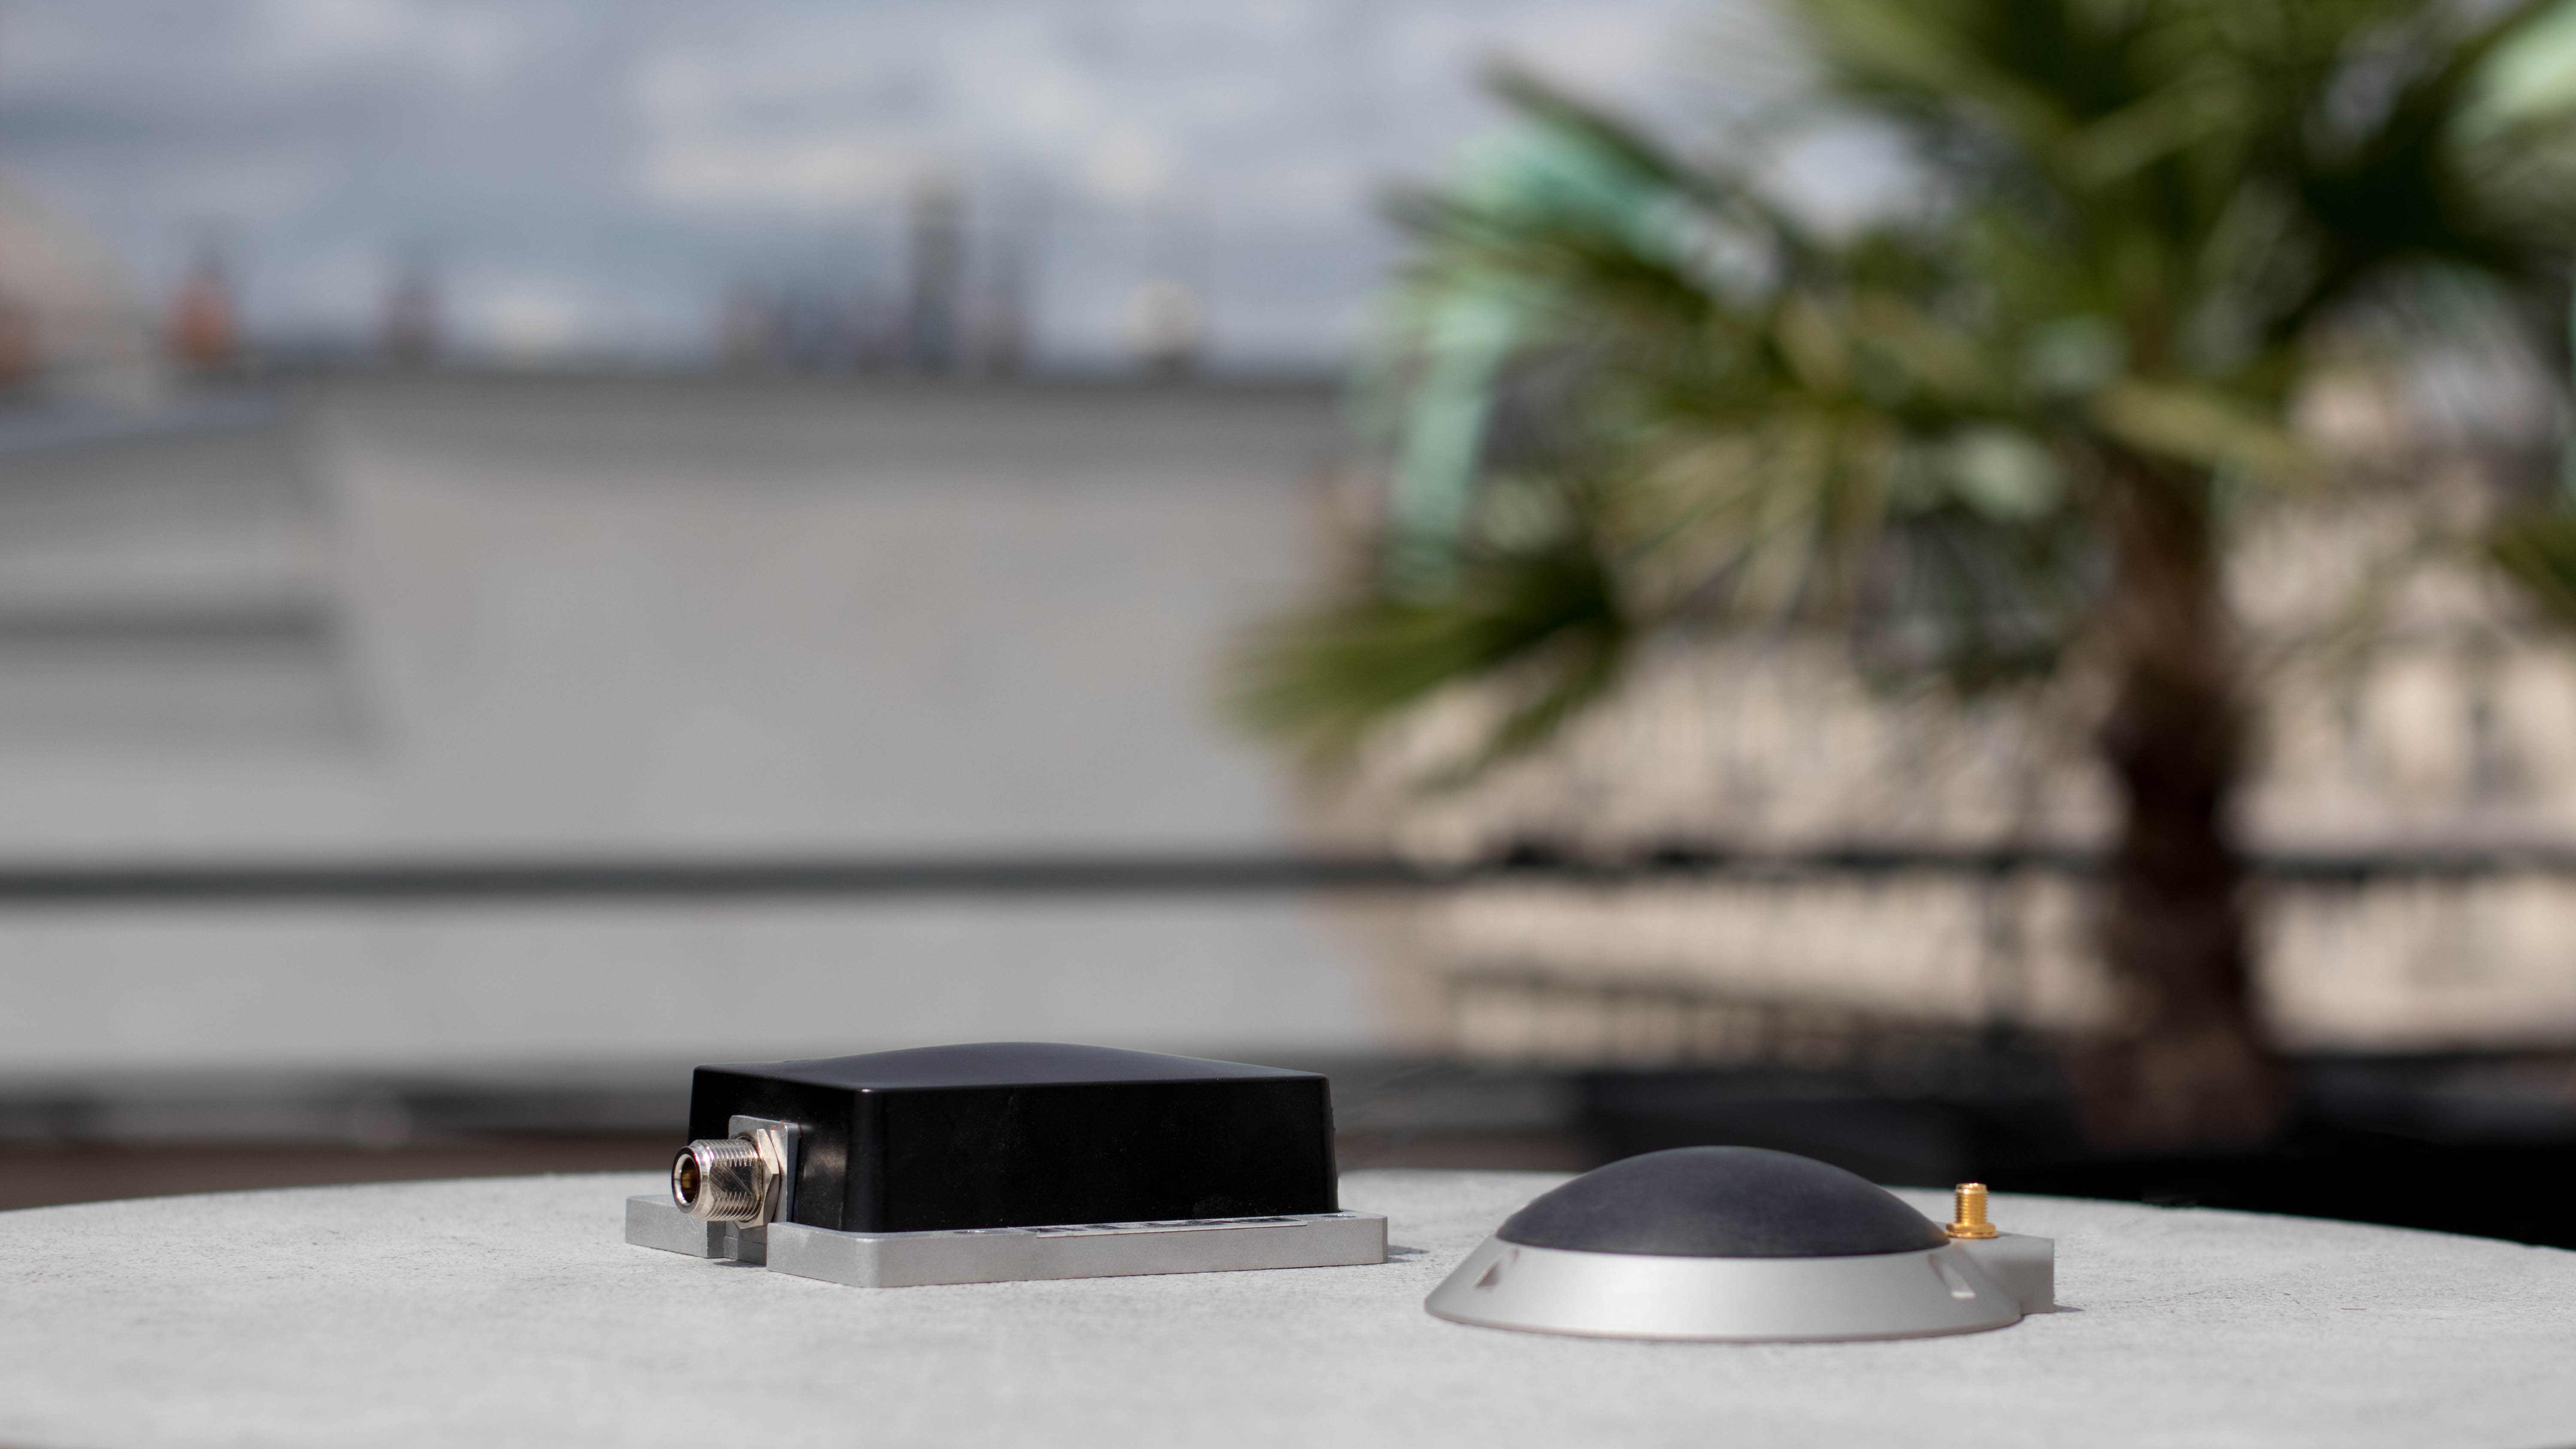
At Ophelia Sensors, getting continuous and reliable data is at the heart of our DNA. We have experts dedicated to check and warn you if anything needs your attention. We know on-field operation can be complicated: you might have limited access to the sensors, or an on-field intervention might be very costly. That is why we made the Geocube as rugged, discrete and low-profile as possible. These things are tough!
Whenever using on-field remote sensors, one key issue is to make sure everything operates properly. At any time, you can check your installation on the user interface. There, you get live, up-to-date information about the on-field equipment. On the Home page, a color scheme gives you the general status of each Geocube in the blink of an eye.
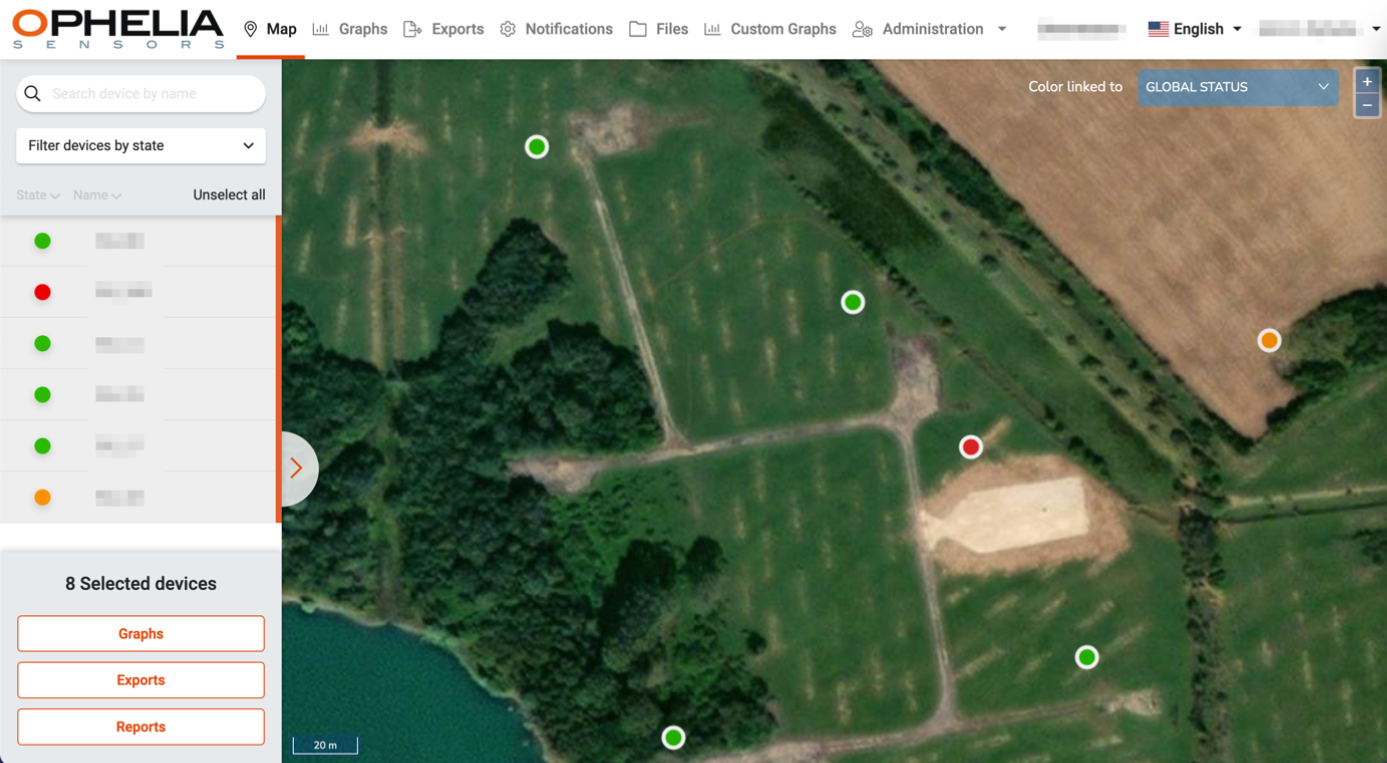
You can spot which Geocube needs immediate or delayed attention and which ones are working normally. You get direct information regarding :
If in any doubt and you want to dig into the operating conditions of your Geocubes (Has anything changed? Does the overhanging crane have any effect on my Geocube computation? etc.), there’s a bunch of tools available on your project interface which will allow you to have a complete understanding of what’s going on.
Not enough? Make sure to contact our team to let us know if you have any doubts, so we can figure out together if an on-site intervention is necessary to change a battery or prune a tree!
Besides, our operational team continuously inspect all running projects so, if you’ve missed anything important, there’s a fair chance our team will send you a message to let you know! Bottom-line is: we got you covered!
Geocube power consumption is around 200 mW when active and roughly 15 mW when in sleep mode. Although we make our best efforts to keep these figures as low as possible, you will still need some external powering to get the cubes working. We procure all types of powering devices, but you can also choose to take care of it on your side. Whatever the option, remember to use the matching connectors to keep everything safe and watertight!
There are typically 3 ways to power a Geocube :

If in any doubt over what the best option is for your project, feel free to ask our team!
Geocubes being a satellite-based system, a decent sky view is essential to get precise measurements. All the rest, we’ll manage. You might have tricky radio conditions, powering issues, accessibility problems, we’ll find a way around it.
Geocubes are designed to be easy to install: once powered, your cubes will automatically connect to your server and, after a warming-up phase, precise position data will start flowing to your user interface. No calibration or complicated settings to configure.
Once you’ve ordered your first Geocubes, Ophelia’s operation team will take over to make sure everything runs smoothly. Once logistics are sorted out, Operations will provide a quick training to go through the basics of setting up a project so you feel comfortable once you get on site. We’ll review together the equipment you received, connect to your project site and walk through the different steps to get the data streaming to your user portal. Nothing tricky, but it’s always better to have done it once in your office before you hit the field!
Need to change something after launching your project? Don’t worry, you can add, remove or change a Geocube’s position as you go along, without interfering with the rest of the cubes. Furthermore, while you’re on the field, you don’t need to worry about any of that. You can set up everything remotely.
Focus on where to install the cubes, we’ll take care of the rest. And when your project is over, just uninstall your Geocubes and get them to the next one!
Once you’ve set your hand on your Geocubes, we’ll make sure you’ll get proper training to feel comfortable using the system. Once your project is launched, you’ll have unlimited access to the interface corresponding to your project and we’ll also provide whatever support you request, provide updates and undergo daily routine checks to make sure your project is running smoothly.
So yes, there is a subscription fee which comes as a calculation credit.
Under normal operation, the algorithm typically computes around 1 million precise position a year (yes, that’s 1 year divided by 30 seconds). So, if you have a project with 20 Geocubes running for a year for example, you’ll have to buy a 20M calculation package if you want to go through the period.
Credit calculation basically means you only pay for what you get.
Project is delayed? No cost.
Project is interrupted? Use your Geocubes and the remaining calculation credit on another project.
As a rule of thumb, yearly subscription costs amount to around 10% of the price of the equipment installed.
Your project, your data, so the least we can do is to provide an easy and smooth access to all the data relevant to your project.
All computed, precise positions are sent to the interface corresponding to your project. There, you can take a look at the displacement graphs, check possible correlations between any data (how does my bridge move with the temperature? Does point B move when point A moves?), follow the evolution of your batteries, print automatic reports and a whole lot of other stuff.
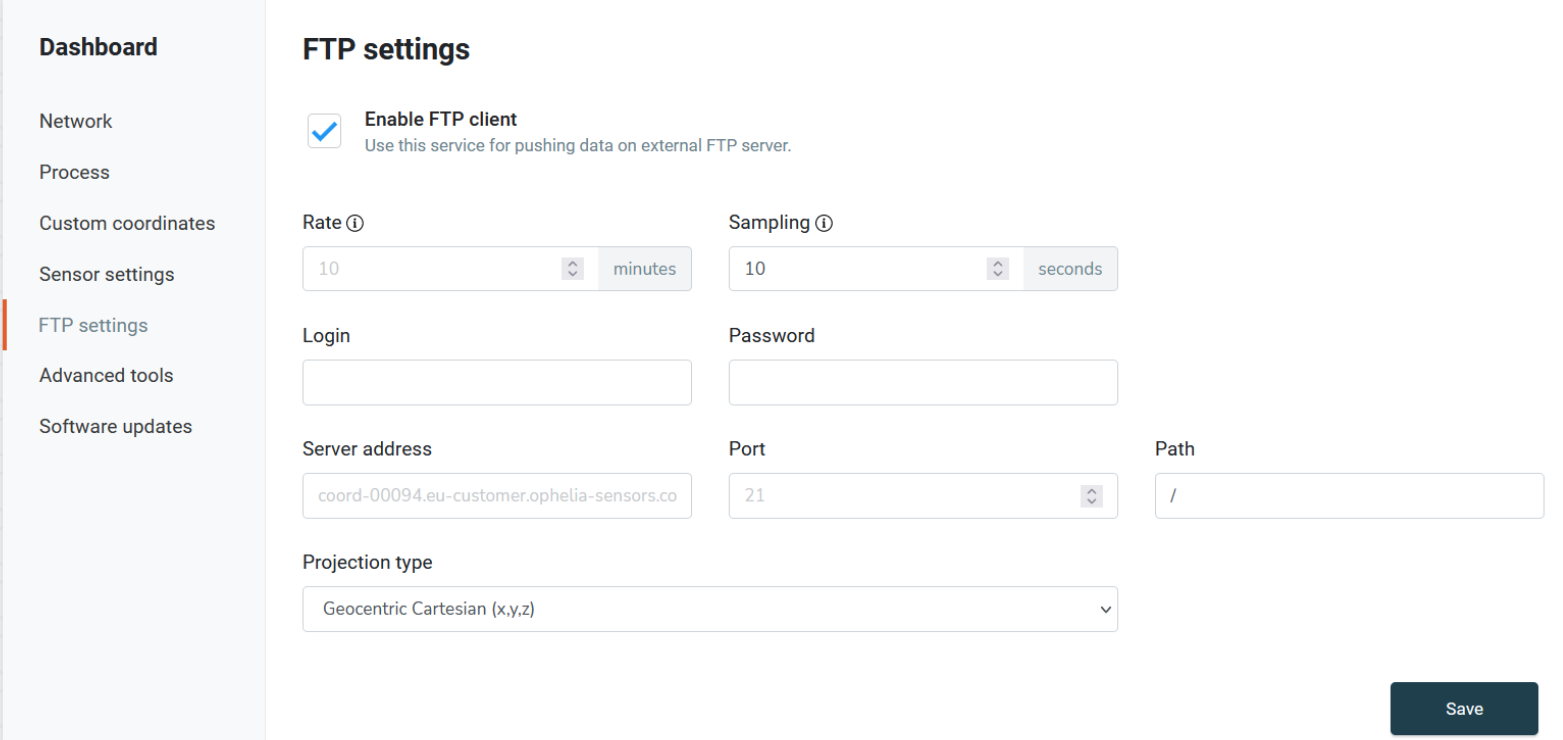
If you want to review your data with your own software, nothing easier. Just select whatever data you need and download it directly to your computer. You can also set up an automatic download to your company’s system through an FTP, SFTP, or HTTPS request.
If you have a project in mind and you’ve never used any Geocubes before, drop us an e-mail (info@ophelia-sensors.com) or call us (+33 1 42 74 59 21) to explain the main features of your project (monitored structure type, duration, expected movement, number of points, required precision, frequency of measurements...). If you already have a map of the project with the projected layout of the measurement points, even better!
We’ll check with you a number of points, amongst which :
Based on this information, we’ll provide you with a detailed quote with everything you need! If we’ve made any assumptions, we’ll explain why and if we feel you should pay attention to a specific issue, we’ll let you know. You’ll typically receive the quote a couple of hours after we spoke.
If you’ve already installed a Geocube project, well, there’s a fair chance you’ve already picked up the feel for it and you can design your project without any assistance. If you’d nevertheless like to check everything, just give a shout, we’ll be happy to review everything.
In any monitoring project, you want to avoid installing sensors which don’t fit the purpose or work inadequately. So, to check whether Geocubes are fit for monitoring your project, you can run this quick checklist:
Expected movement :
Geocubes are designed to monitor slow movements: if the movements you are expecting are below 10cm per hour, then Geocubes can probably do the trick.
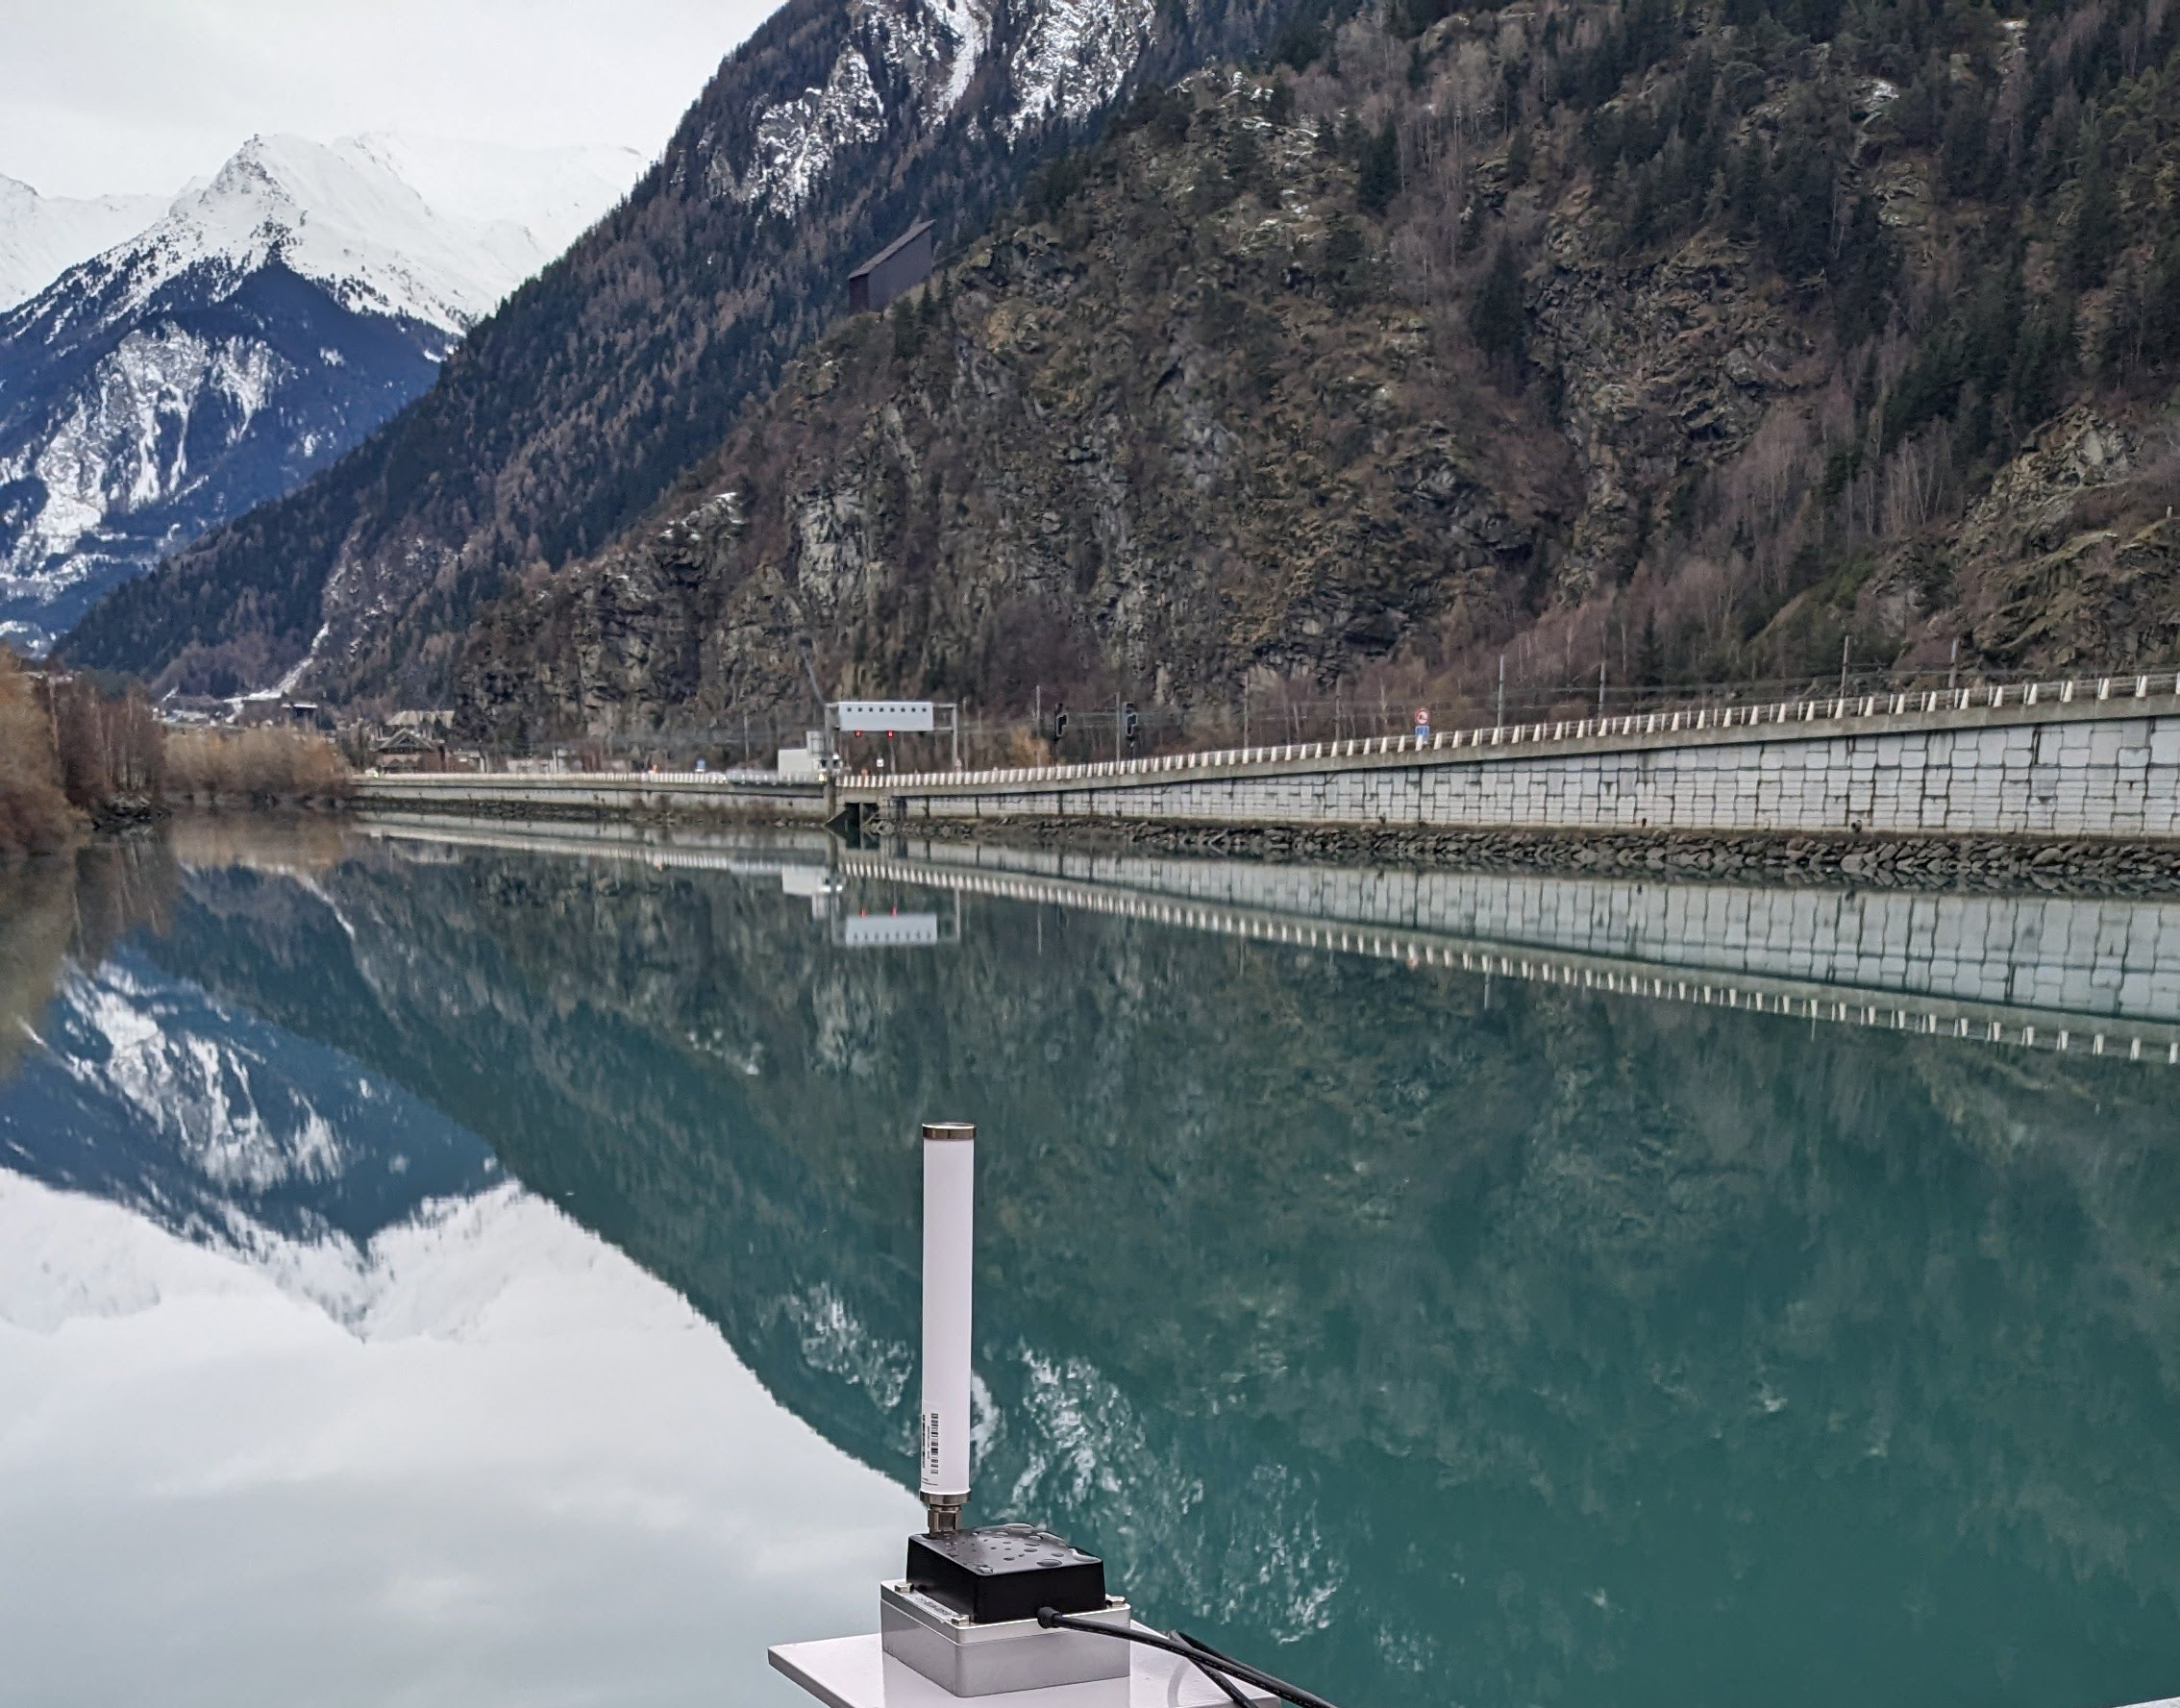
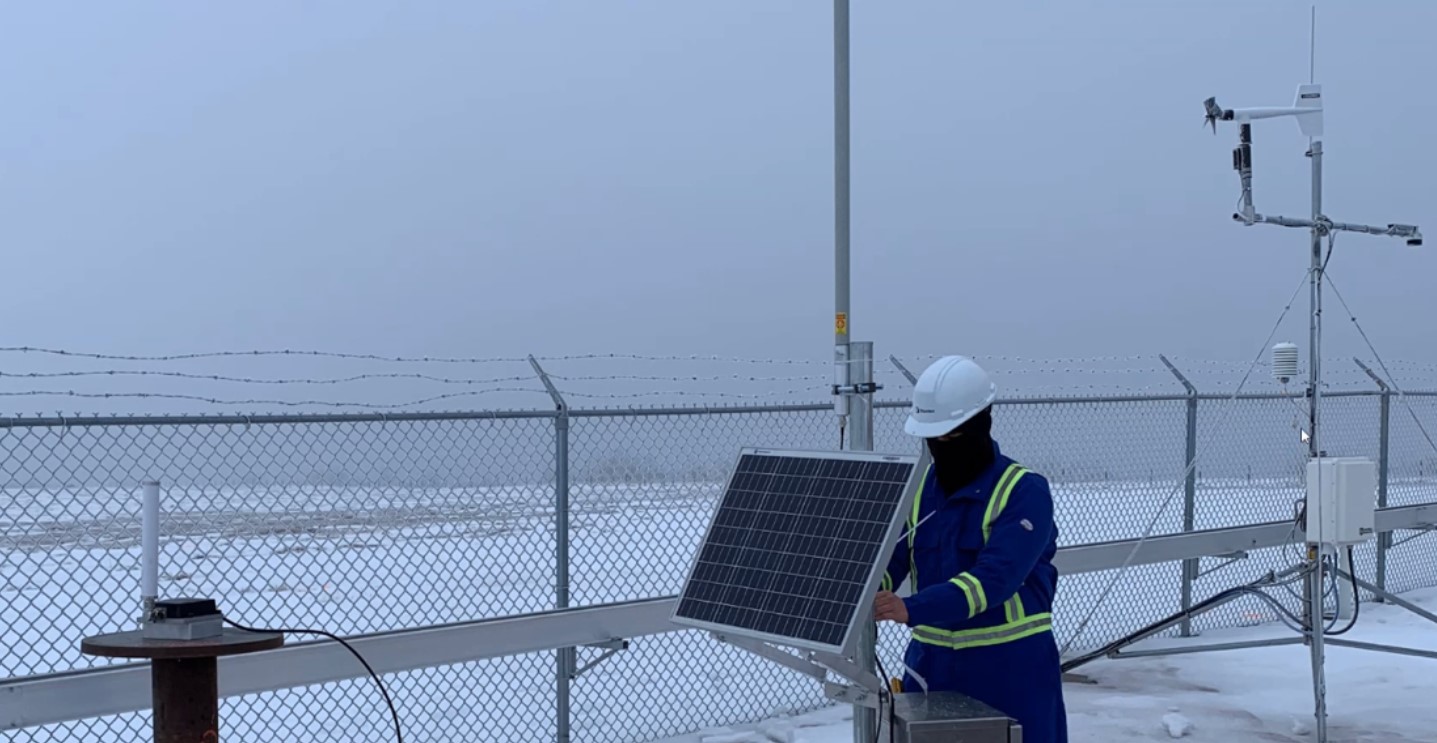
Skyview :
Geocubes are GNSS based sensors so you’ll need a decent skyview for them to work properly. Skyviews are never perfect, that would be too easy, but Geocubes are designed to work in poor environments. If your skyview is really subpar, you will probably have a loss in precision. Ideally, this is what the installation of a Geocube should look like :

Cellular connection :
Whether it be 3G, LTE-M or NB-IoT you will need some kind of cellular network to get the Geocube satellite data to the server for calculations. If there is none but you have internet on site, that will also do the trick.
If all these points are covered, then Geocubes can be used on your project. If in any doubt, just drop us a mail at info@ophelia-sensors.com with some information on your project and we’ll answer within a day.
You have an expensive Weather Station installed onsite but you can’t retrieve its data easily. You want to install piezometers or automatic extensometers and get alerted in real-time?
Thanks to our local radio network, and to the onsite Gateway, you can plug in any kind of sensor to the Geocube system. The data will be uploaded in real-time and will be accessible on our customer platform. There, you can use all the visualization tools natively available. You can also set up an automatic data download to your own system, like you would do for any Geocube.
To link a sensor to the system, you’ll need something able to send data through the widely used RS232 or RS485 protocol. We take care of the rest! For any specific project, shoot us an email at info@ophelia-sensors.com and we’ll answer within a day.
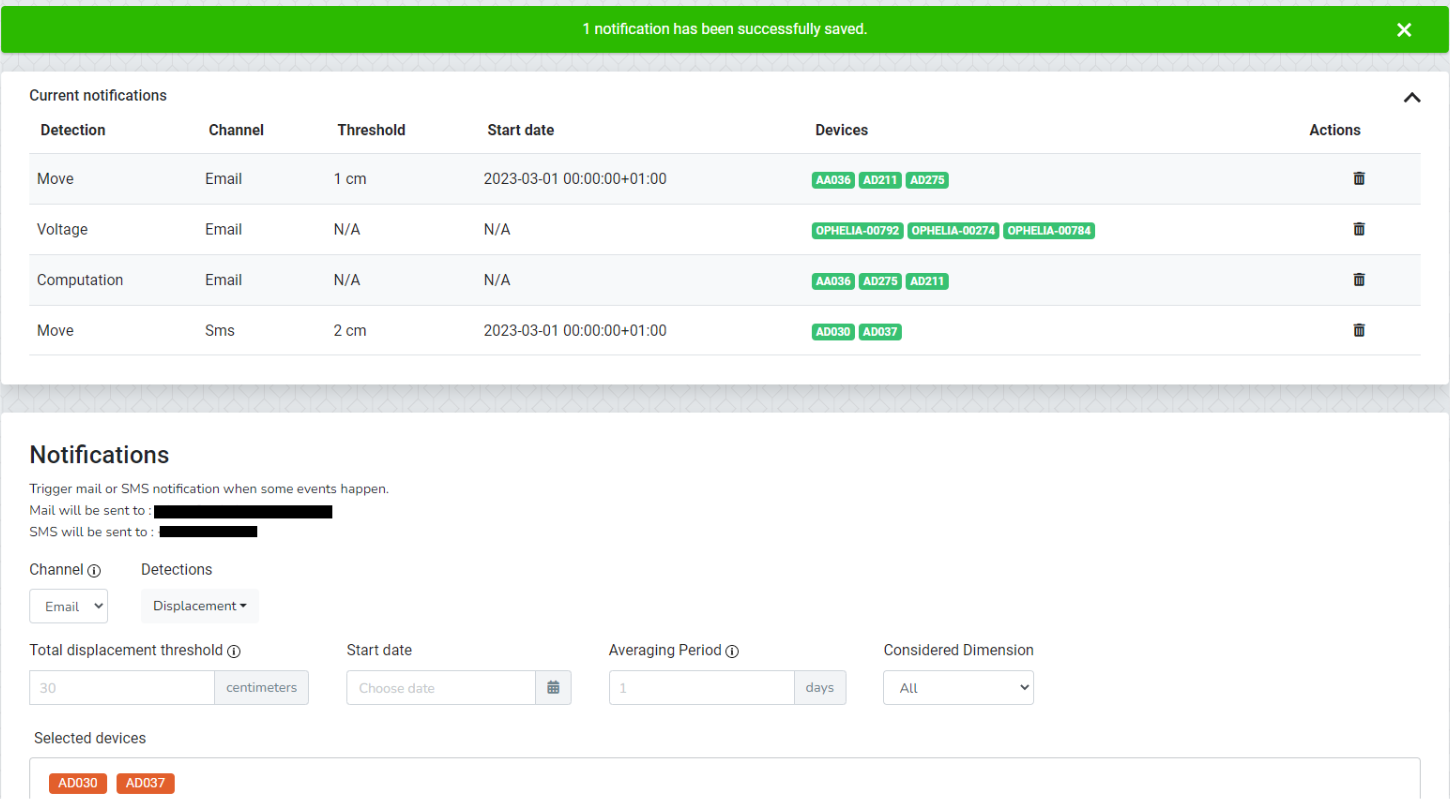
Continually checking the displacements and the status of your Geocubes will definitely be a very wearying occupation, which is why we designed a notification page that simplifies the monitoring of your installation.
We have set up three types of notifications :
To simplify the communication, we’ll send the notifications through e-mail or even directly to your phone by SMS.
Each user can set his own set of notifications and there are no limitations as to the number of movement notifications for a Geocube. You can set for any given Geocube, a slow, fine-tuned warning for slow subsidence movements and a more reactive, coarse notification in case of sudden movement.
For example, consider you want to monitor the height of a structure, for which the horizontal movement is not of first interest. You would like to be warned very precisely if the structure varies in height : you could set a vertical alarm at 8mm over a period of 3 days. You might also want to have an alarm over the full displacement to make sure the Geocube wasn’t accidentally displaced, which could affect the measured height in which case you would set an alarm at 5cm in all dimensions over an averaging period of 6 hours, which should let you know if any installation problem occurred. Finally, you can configure an alarm on the voltage to let you know that your battery is running low, and that an operation on-site needs to be scheduled.